Installation Steps
> To install ‘MappyField 365’ plugin, the following steps are to be followed:
On purchasing the plugin, you will get a zip file named “MappyField 365 365.zip”.
Login into your CRM Account and click on Settings -> Solution.
Click on ‘Import’ to upload and install the Solution. [1]
Click on ‘Choose File’ button and choose the Package Zip File for MappyField 365 from the Import Solution Window. Click on ‘Next’ for further processing. [2]
Note: You will get the MappyField 365 package zip in the main folder of the MappyField 365 and find the package in that folder. MappyField 365 à MappyField 365_V6.0.Zip.
Check the box to enable any SDK message processing steps included in the solution and click on Import button to Import the Solution. [3]
Click on ‘Close’ after successful completion message is displayed. [4]
Once you import the solution, it will be displayed in the solutions grid view. [5]


Activate Your Free Trial
Double click on ‘MappyField 365’ solution to configure the plugin with your license key.
This will open up a new window. Click on ‘Configuration’ from the options provided on the left side.
You can activate your one-month free trial. To get a one-month free trial license key, fill out the details and click on ‘Activate’. [1] [2]
Your trial will get activated and expiry date will be displayed on top.
You can purchase the licensed version any time. To purchase the license, click on ‘Buy Now’. [3]


Insert Licence Key
Enter the New License key received in mail. This will enable the ‘Activate’. [1]
Click on ‘Activate’ button to activate your license.
Default settings under set up tab can be managed only if a user has System Administrator Role, AppJetty MappyField 365 Admin. Or else it would show error message stating “You don’t have administrative rights. Please contact administrator.”

Activation
On expiration of Trial, a message will appear that the Trial is expired. [1]
Now to purchase the license click on ‘Activate’
This will redirect you to our product page and a pop-up will appear. Click on ‘Add to Cart’ button and complete the purchase process. [2]
On successfully completion of the purchase process, you will receive your license key via email along with steps to complete the license configuration.


Bing Maps Configuration
To manage the default configuration settings of MappyField 365, click on ‘Setup’ tab and enter default configurations.
Admin user can set the default view of the map by configuring from here.
Bing Map API Key: Enter Bing map API key which you have generated from.
Note: To assist you further, you will find a link beneath the text box that states How to generate Bing Map API Key.

Default Configurations
Under “Default Configuration” option, set default Latitude, Longitude and Zoom level for map when it is opened for the first time.
You can set the default location using the map as well by clicking on “Set latitude, longitude and zoom level on map” option available on the right-hand corner. [1]
By clicking on it, the map will open in new window. You can set the location by moving the icon as shown in below screenshot. [2]


Default Limits
Set “Default Limits” for distance unit and direction.
– Distance Unit: Select to measure the distance in ‘Kilometers’ or ‘Miles’.
– Direction: Select the direction as per either ‘Shortest Time’ or ‘Shortest Distance’.

General
Heat Map Settings: You can also set colors for ‘Heat Map’ configuration which would indicate the intensity of the data. i.e. High, Medium, and Low.
Enable Live Traffic: A user can also enable/disable Live traffic on Bing Maps and Optimize the route using SPF (Shortest Path First) feature from the configuration.
Optimize Route: By enabling this option, the users will get the Routes based on the SPF algorithm.
Assign Territory: By enabling this option, every time when you or the Dynamics users will create a new Account and a new Lead, the Territory is automatically assigned to those records.
Note: Assign Territory option is only for the Account & Lead entities. The territories assigned automatically if the territory is already created for that area when record is created.
Click on the Save button to save the settings.

Google Map Configurations
– Enable Google Maps: Checkmark the box to enable the Google Maps in MappyField 365.
– Google Map API Key: Enter the Google Map API key which you have generated.
Note: To assist you further, you will find a link beneath the text box that states How to generate Google Map API Key.

Default Configurations
Under “Default Configuration” option, set default Latitude, Longitude and Zoom level for map when it is opened for the first time. [1]
You can set the default location using the map as well by clicking on “Set latitude, longitude and zoom level on map” option available on the right-hand corner.
By clicking on it, the map will open in new window. You can set the location by moving the icon as shown in below screenshot. [2]


Default Limits
Set “Default Limits” for distance unit and direction.
– Distance Unit: Select to measure the distance in ‘Kilometers’ or ‘Miles’.
– Direction: Select the direction as per either ‘Shortest Time’ or ‘Shortest Distance’.

General
Enable Google Map Geocoding: Checkmark the box to enable the Google Maps Geocoding in MappyField 365.
Click on the Save button to save the settings.

Live Tracking
You or a DynamicsCRM users can enable/disable the Live User tracking feature from configuration to track the CRM users (team members).
You need to configure Firebase details for User’s Live Tracking in MappyField 365:
> API Key > Database URL > Storage Bucket > APP ID > Authentication Domain > Project ID > Messaging Sender ID > Location History
Enter days: Enter days for which you want to get the history of the selected user’s activity.
After inserting the ‘Firebase’ configuration details for Live Tracking, click on the Save button.
Note: Firebase configuration is required to enable user tracking in MappyField 365. You need to register the project with the Firebase.

How to configure the Firebase?
We must configure the Firebase for “Live tracking”. Follow the below steps:
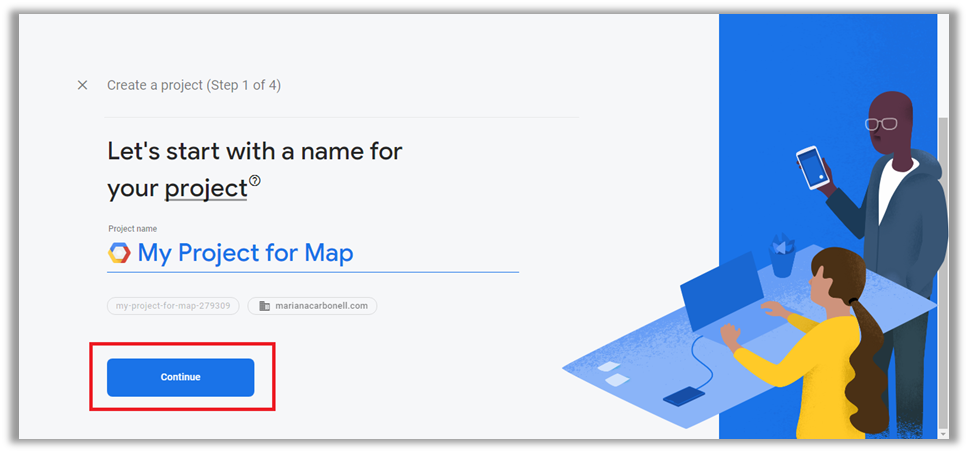
Go the Firebase website, open this link: https://console.firebase.google.com/
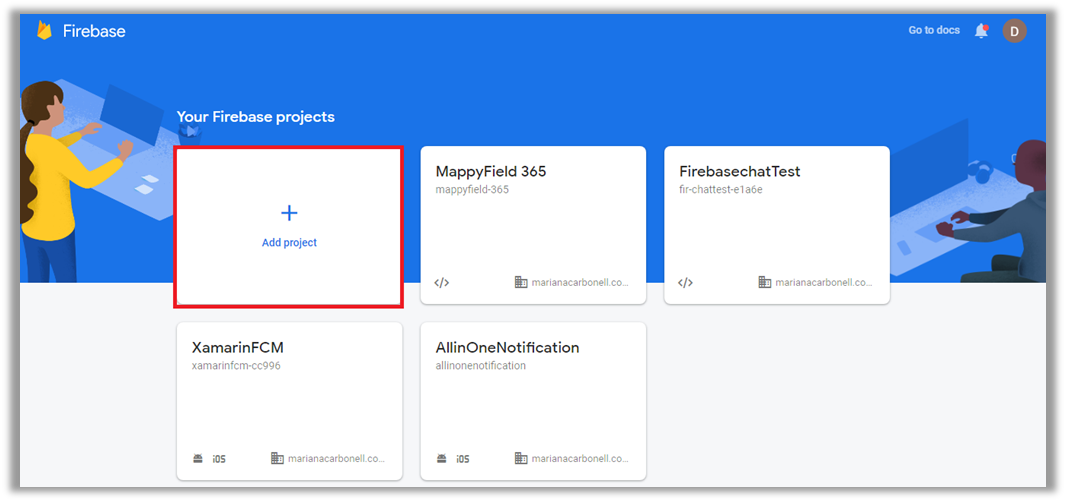
Here you need to add a new project by clicking on the + Add project.
Give a suitable name to your project and click on Continue to configure the details.
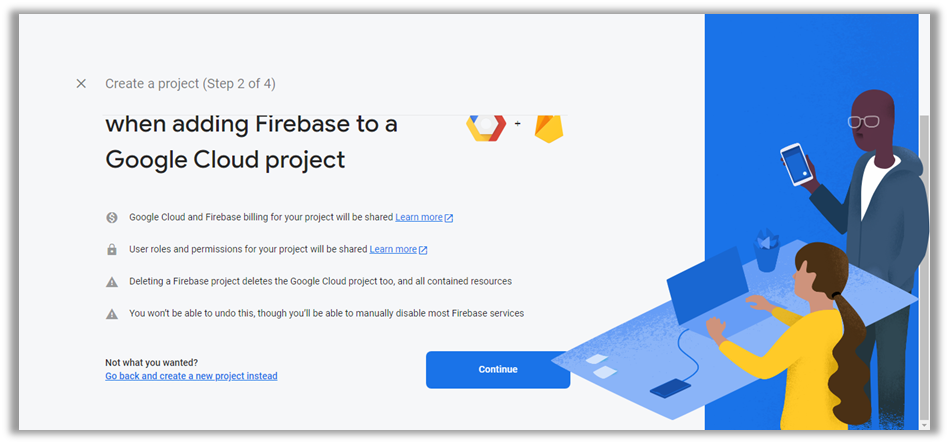
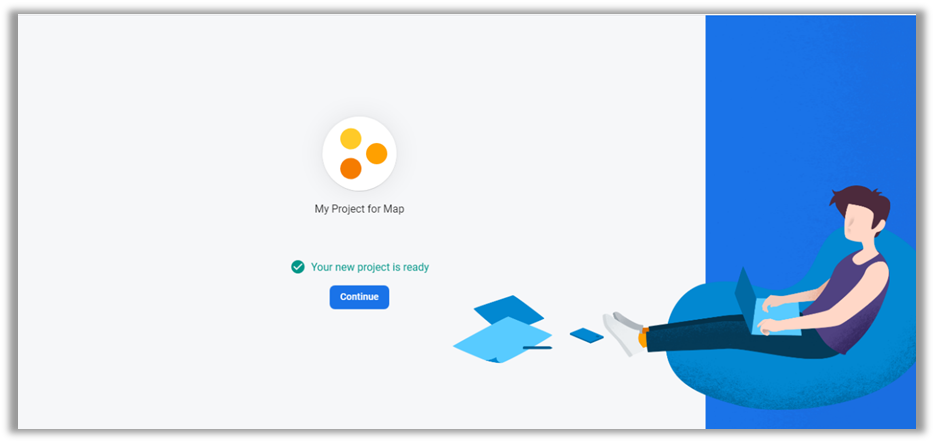
In next, you will find the “Add Firebase”, click on that.
By click on that, the project will be created.
Click on Continue for next details.
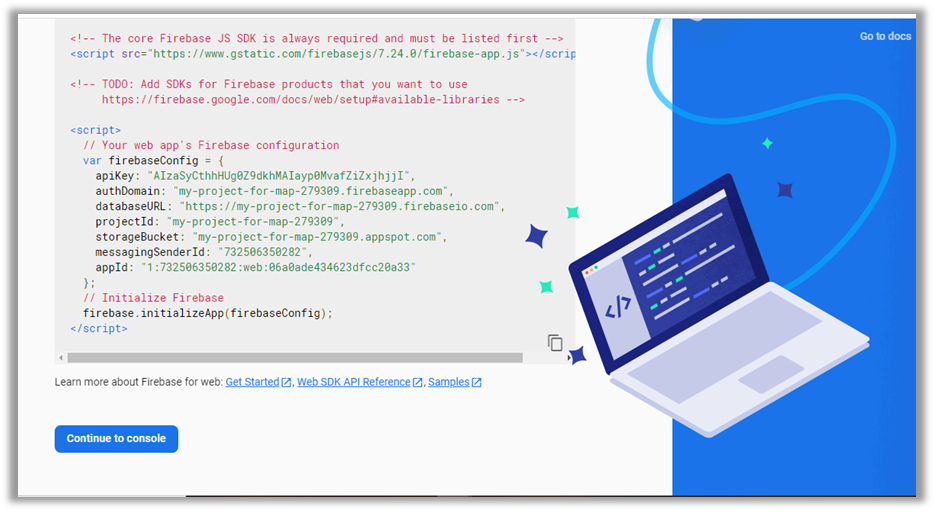
Click on </> icon.
Now register the app by inserting the relevant name to web app.
After registration the web app, you will get the script which you have to copy the code and you must enter in MappyField 365 configuration for live tracking.
Click on Continue to console.
In this way, by configuring the Firebase and inserting the Firebase details into the MappyField 365 configuration, you can enable the Live User tracking feature.


Configure Languages
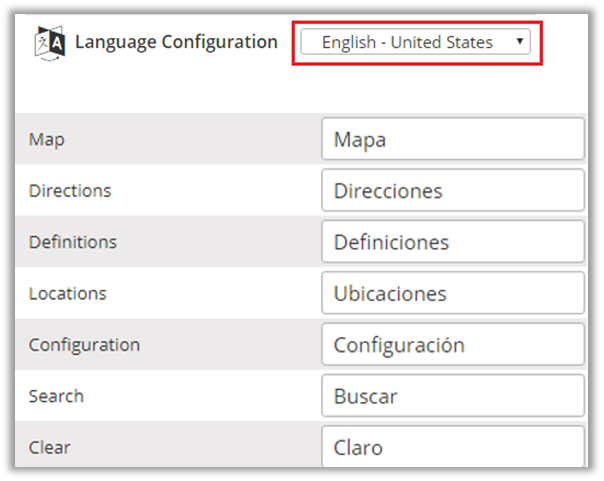
You can also configure language of your choice by clicking on Configure Languages button available on Setup page.
Select the language from dropdown that you wish to configure your messages.
Here, you need to add translations for the messages in the language of your choice.
Click on Save button to save the language translations.
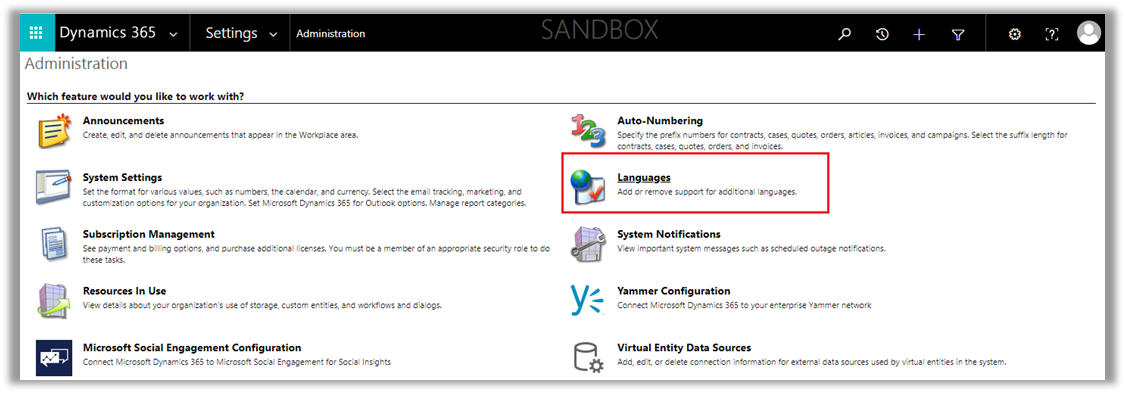
Note: To configure languages, user first needs to manage language settings from CRM. Languages that are selected in CRM can be listed for the MappyField 365.
Go to Settings –> Administration –> Languages to enable/disable the languages.
You can enable or disable multiple languages from the list. After settings the language, click on the Apply This allows you to change languages in Microsoft Dynamics 365.
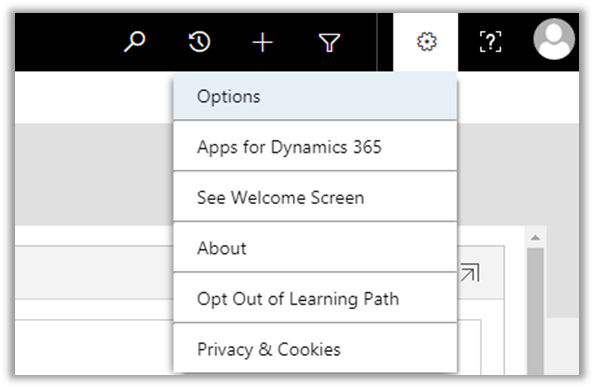
Click on the Settings gear icon at the top right of the screen, choose Options to open the Set Personal Options window.
Go to the Languages tab, select your user interface language, then click OK.
Once you select the language here, that language will enable in the ‘Configure Language’ of MappyField 365 Setup.

Assign User Roles
To manage the user roles, navigate to Settings -> Security -> Users.
Now select the users whose roles are to be managed and click on ‘MANAGE ROLES.’ [1]
This will open a pop up to select roles. [2]
The available roles for selection are AppJetty MappyField 365 Admin or AppJetty MappyField 365 User role.
User with AppJetty MappyField 365 Admin role can perform all the actions like System administrator while user with AppJetty MappyField 365 User role can do all actions except delete actions.


User Wise Map Configuration
On assignment of any role like AppJetty MappyField 365 Admin, AppJetty MappyField 365 User or System Administrator role, configuration settings record must be created. This can be accessed by navigating to Map Configuration. [1]
On navigating to MappyField 365 Configuration, it would show list of all the users with MappyField 365 role or System Administrator. [2]
Note: These configurations are default user-based configurations that will be set as default when map is loaded.
- Following are the configurations: [3]
– Map Mode: User can select default map mode. It can be road or aerial mode.
– Zoom Level: User can set default zoom level for the map. It can also be managed based on settings made from the contextual menu.
– Plot Data: Default plotting of data can be defined. Either it can be in cluster or non-cluster format.
– Distance Unit: Default option for distance measuring. Either miles or kilometers.
– Route Options: You can define best way to determine route from this feature.
– Default Location: The user can define the default location using this option.
– Default Origin: The user can define the default origin using this option. It can also be managed based on settings made from the contextual menu.
– Default Destination: The user can define the default destination using this option. It can also be managed based on settings made from the contextual menu.
– Along the route distance: Define radius of along the route search.
– Along the route distance unit: Define default unit for along the route search.
– Security Template Configuration: Define the default ‘Security Template’ for the user if required.
Note: Here the list of the Templates will appear as per the Security Template Configurations.
– Navigate via: Select navigate to check the routes by using Google Maps, Waze Map or Apple Map.
– Check In: Enable or disable the ‘Check In’ module. If you enable the Check In, Check In Radius (KM), the option will get enabled.
– Check in Radius: Define Geo Radius that can be allowed to perform any check in. [4]


Security Template Configuration
The only System administrator or User with AppJetty MappyField 365 Admin role can create Security Template for other CRM users with AppJetty MappyField 365 User role. User admin can assign selected actions to different users using security templates for the different CRM users i.e. Sales Reps, Service Executive, Field Reps, etc.
From the MappyField 365 navigation panel, you will see the Security Configuration to give the accessibility of the map and functionalities.
By clicking on the “Security Configurations”, you will be redirected to the “Active Security Configurations” where you can add the new security template for the CRM users. [1]
With admin rights, you can add a new “Security Template” by clicking on the “+ New” button from the action ribbon or you can edit the existing template if any changes/modifications are required.
If you have admin rights, you can add a new security template. You need to insert the “Name” and change the “Owner”. [2] You can save the template or navigate to the “Action Configuration”.
Once the security template is created and configured, you can select it from the “Map Configuration Detail”. So, that configuration detail of the map will be displayed in the “Configuration Details” option.
By navigating to the Action Configuration, you can manage the different action options of the map by enabling/disabling as per the requirement.
You will see different action options as follows:
– Infobox Actions
– Bulk Actions
– Search Options
– Context Menu Actions
– Floating Button Actions
Infobox Actions
You can select options for Infobox action (detailed card) that will appear on the right when you or CRM users click on any pushpin (a record). [3]
Bulk Actions
You can enable the bulk options when you or CRM users perform such actions from the data grid view. [4]
Search Options & Context Menu Action
Search Options: You can manage the options that will appear to plot the records in the Plot menu. [5]
Context Menu Actions: You can manage the options that appear on the context menu when you or the CRM users right-click on the map. [5]
Floating Button Actions
Floating Button Actions: You can manage the advanced options on the map that appears on the left side. [6]
After managing all the options as per requirement, click on the Save option to save the security template or click on the Save & Close option and you will be navigated to the listing page of the security template.
Note: After saving the security template, it would enable the “Configuration Details” section from where you can directly assign that template to a user (Map Configuration Detail). Similarly, when you are adding a new map configuration detail record, you can also assign the security template as well.


Entity Mappings
Navigate to Configuration -> Entity Mappings to display the entity with its relevant details on MappyField 365. From here you can add a new entity and configure its required details. [1]
By clicking on Entity Mapping, the list of entities can be seen which are already mapped.
Click on “New” button, this will open a new window for mapping an entity. [2]
Entity Name: Select the entity you want to map. You can choose from all the entities that are present in the CRM by default or the custom entities created by you. [3]
Link To: Check the link to option to link the selected entity to some other entity. After checking the box, you will get a list of relationships with which you can link the selected entity.
Activity Entities work only on Account, Contact or Lead addresses marked as regarding address.
Total Records: It displays how many records the entity contains.
Geocoded Records: It displays how many records are geocoded.
Address Fields: Select the address fields for the entity, to be used for geocoding. By default, it will consider map’s certain address fields. If needed they can be changed.
Automatically Geocode New Records: If it is checked, it geocodes the record automatically as per saving configuration.
Once you have filled all details, click on “Save” button. Entity will be mapped, and success/failure message will be displayed.


Attributes
For mapped entities, further configurations can be managed like Attributes. It includes Detail Attributes and Category Attributes.
‘Detail attributes’ are the ones that appear on card upon clicking on ‘pushpin pointer’ icon. At max 10 attributes can be selected.
‘Category attributes’ are the ones that appear in dropdown for ‘category’ selection. You can select as many attributes as you want for category selection.

Action Configuration
For mapped entities, you can edit action configuration section where you can check/uncheck the action buttons according to your requirement.
This will reflect on the tooltip card. Here, only those action buttons will be shown that can be changed. Default buttons will not be shown in this configuration section.

Data Grid Attributes
From here, you can select the attributes for the data grid. When you plot any data in map or in heat map, grid data will be displayed according to attributes selected here.
If ‘Display Full Address’ checkbox is checked in data grid, it will display records with full address.
You can select maximum 8 data grid attributes.

Data Filter Attributes
Data Filter is provided on the Entity & its View record selection under the ‘Plot’ menu. You need to select the attributes to provide as Filter option. You can select maximum 8 data filter attributes.
Select the required attributes for the Filter option from the Attribute drop down list and Insert the relevant name to be displayed.

Summary Card Configuration
You can make configurations related to what you want to display on summary card.
For summary card of an entity, you can choose the attributes that you want from the dropdown list.
Also, under aggregate method, you can define the way you want records to be summarized. It can be either sum or average. Also, you may define display name of that attribute.
By default, it is same as attribute name. All the selected attributes are shown in the list from where it can be removed as well.

Views Configuration
You can select the view that you want to display on the map for particular entity.

Relationship Configuration
The selected relationship id from the Relation List and the name gets plotted as part of related records associated with a record.
In ‘Relationship Configuration’, Default Relationship ‘radio button’ is given to display the Default relationship at the time of loading the record map.

Tooltip Attributes Configuration
You can make configurations related to what you want to display on ‘tool tip’ when anyone hovers on that record.
For that, you can choose the attributes that you want from the dropdown list. You may also define display name of that attribute. By default, it is same as attribute name. All the selected attributes are shown in the list from where it can be removed as well.
After making all the configurations, click on Update button to complete the process.

Enable Check-In
You will get Check-In & Check Out options for all activity entities along with Add Notes and Attachment options.
To enable the Check In option for the activities like etc., tick the Enable Check In option.
By checking it, you will get the Check-In & Check-Out features for your activity.

Auto Territory Assign
You or DynamicsCRM users can assign territory for existing record. It will automatically select the Territory based on the region.
By selecting any account record, you will get an option as Assign Territory on header (ribbon). [1]
Click on Assign Territory option to select the territory for the selected record. The territory as per the record’s location/region will be selected. [2]


Manually Geocode the Record
Navigate to the record for which you want to manually set a geocode: Latitude & Longitude.
You will get the Geocode as per your selection of view. Here you get the Geocode for “My Active Accounts”. If you have not selected any record, it will get Geocode for all the Records. [1]
Ex. If you want to geocode any record of account, go to Sales -> Accounts and select a record.
After selecting a record and clicking on Get Geocode, the “Latitude” & “Longitude” will get updated as per the address details.
If you check, the account details, the Geocode: Latitude & Longitude is updated as shown in the screenshot. [2]
Note: You get option to geocode records only when that particular entity is mapped from Entity Mappings configuration.
If you changed the address, then you need to manually geocode that record by clicking on the “Get Geocode” button from the menu. [3]


Non-Geocoded Records
Navigate to the entity for which you want to get a non-geocode detail.
For example, if you want to check the Non-Geo Coded records from the multiple records of an account entity, go to Sales -> Account.
Click on Non-Geocoded Record button, it would show listing of all the non-geocoded records along with their address. [1]
You can also view details of the record by clicking on view icon under action column.
For the list generated, you can also perform actions like Copy, Excel, Pdf, Print and Search as well. [2]


Asset (Truck Management)
“Dynamics 365 Asset Management” is about Supply Chain Management, which is used in the daily operation of any organization. It could be machinery, any equipment, or transportation (trucks).
MappyField 365 provides Asset Management separately. From the navigation panel, you will see the Asset menu. By clicking on it, you will be redirected to the Active Assets page.
You will see the ‘truck’ details in the list that are the Dynamics 365 Assets. You can add a new truck and its details or edit the existing one as per requirement.

Add a New Truck
By clicking on the + New option from the header, you will be redirected to the “New Asset” page where you can add a new truck with the required details.
You need to insert the required details for your truck asset. You need to insert the Hazardous Material that the truck would carry out during the transportation. You will see the drop-down list of different materials and you can choose the multiple options from that drop-down as per requirement. [1]
After inserting all the details related to the truck (Asset), click on the Save or Save & Close option to add the asset. You can select the Truck as per your defined “Routes” to transport the products or other stuff. [2]


Define Geography
You can define the geography for the territory from the CRM backend. To define the geography of the territory, navigate to the Advanced Settings → Settings → Business Management. [1]
You will see the Sales Territories option to manage the territories from the CRM backend. You can also define the geography of the territory as well.
By clicking on the “Sales Territories”, you will be redirected to the list of the sales territories page. You can create a new territory and define its geography.
By clicking on the + New option from the header menu of Dynamics 365, a new web browser will open to configure the new territory by defining the geography. [2]
Once the general details are added, you need to save the territory and the territory is created. After that, you can define geography. If you want to add the territory under another territory, you can select the main (parent) territory in the “Parent” option. [3]
Now, by clicking on the Define Geography tab, you can define the geographical area of the territory on the MappyField 365 only.
Click on the “Territory Management” and then plot the territory by using search options. [4]
Now, the territory is plotted as per the search options. [5]
Once the territory is plotted, you need to select the territory using the selection tool (hand icon). [6]
After selecting the area using the selection tool, you need to right-click on the selected territory (area) to create new geography. [7]
You can see the added geography in the list. You can add multiple geographies (areas) for the same territory by searching options. [8]
You need to click on the Save option to save the territory with the geography. Once you add the geography, you or CRM users can plot it as a Territory in the MappyField 365 map.


MappyField 365 section in Record Details
MappyField 365 is separately provided in the Details page of any record of all the mapped entities.
Click on any record of account entity. [1]
By clicking on the account name, you will get the summary and the details of that account and by scrolling down, you will get the separate ‘MappyField 365’ section.
On map there is a pin plotted based on the address entered for the record. [2]
To update the latitude and longitude of the record, you need to move the pin to the desired location. On moving, it would prompt a confirmation message. Click OK to update and continue.
You can update latitude and longitude using record map for records of Account, Contact and Lead Entities.
Along with that there are three action buttons: Proximity, Get Related Records and Refresh.
Find Proximity: Clicking on it, you can perform proximity search from that pin and find records nearby. It would show records based on entity selected from the dropdown. [3]
Refresh: This button would just refresh the map to default map type removing any action performed on map.


View Map from Entity Menu
The map options are provided in all the entities on the header.
You can access the Map and Heat Map from the Entity. [1]
By clicking on ‘Map’ or ‘Heat Map’, you will be redirected to the details of the Maps for that particular entity. [2]


Bing Map
MappyField 365 Map View & its functionalities
Select the MappyField 365 from the Dynamics 365 dashboard or app list from the header. [1]
By clicking on the MappyField 365, you will navigate to the Map view of the MappyField 365 with all default configurations and all the entities which are already configured in Entity To Map. [2]


Map view & its options
You can plot the Entity records and perform the different actions and activities from the Map.
Map view options:
1. MappyField 365 navigation pane for Bing Maps, Google Maps and Configurations.
2. You will have five tabs (options) to view and search the records by selecting the fields and options:
-> Plot -> Routes -> Templates -> Locations -> POI (Point of Interest)
3. There are three Quick Navigation are provided:
Calendar View -> Heat Map -> Territory Management -> MappyField 365 Configurations (default setup).
4. The options are:
-> Default Location address details as per the ‘Map Configuration Detail’,
-> Search a specific record/location,
-> Get help related to MappyField 365,
-> Full View of MappyField 365 map.
5. Refresh the MappyField 365 map.

Default Location
You will get the default location with the pin on the map as per the configuration in Map Configuration Detail. [1]
You can set the default location from the Map by right-clicking on your specific location.
As you right-clicked, the map view options will appear. Click on Save Settings > Default Location. [2]
By clicking on the ‘Default Location’, the pushpin of the default location will be changed with new address on the map. [3]


Select Entity
By clicking on the Plot, you can plot the multiple records by selecting the different entities. [1]
First, select Entity from the ‘Select Entity’ dropdown option. You will get the dropdown list of entities as per mapped in Entity Mappings configurations. [2]
Select View from the ‘Select Entity’ dropdown option. [3]
After selection of ‘Entity’ and its ‘View’, you can Filter the attributes and plot the specific records of the selected attributes from the Filter option. [4]
By clicking on the “Filter” icon, a popup will open to select the attribute of Account entity to plot the records based on the attribute selection. [5]
Note: You can plot the records on the map based on the attribute selection that are configured from the option of the ‘Entity Mappings’ in the Data Filter Attributes option.
Once you have selected the Attribute, you need to insert its value. After selecting the attribute and inserting its relevant value to filter the records, click on the Save button. [6]
By clicking on the ‘Filter’ icon, a popup will open to select the attribute of Account entity to plot the records based on the attribute selection. [7]
By using the custom filters, the DynamicsCRM users can plot records between the dates or plot records with the specific status as per configuration in the Data Filter Attributes option from Entity Mappings.
Now, click on Search button to plot and view the records of the selected entity on map.
All the records of the ‘Accounts’ are plotted on the Map which is highlighted in the red pushpin. [8]
In this way, you can plot the records by selecting the Entity and its attribute in the View. The records will be plotted as per the filtered attributed as you have selected the Filter option for the Entity.
The multiple entities selection option is also given to plot and view the multiple records on the map.
To select another ‘Entity’, click on + Add Legend text caption. As you click on it, the “Select Entity” option will be added. [9]
Now, select another Entity and select its View then click on Search You can also filter the attributes of the selected entity to plot the records on the map. [10]
You can plot the records by selecting multiple entities, but you can select a maximum of 5 Entities at a time.
On selection of more than one entity, pins with different colors get plotted based on the records of entities. On map, Accounts are plotted in red pin and Leads are plotted in green pin. [11]
If entities like Account, Contact or Lead are mapped under the ‘Entity Mappings’ configuration, only then you can select those entities and plot the records on the map.
The Sales Reps/Executive (DynamicsCRM Users) can also access the MappyField 3365 from the mobile/tab. [12]


Pin selection for records
Every time when you add a new entity the pin will be added with different color.
Multiple pin options are also available to differentiate multiple entity (legend) records, options will be listed by clicking on existing pin.
You can change the pin color and its shape by clicking on the pin of any entity. Select different pins for the multiple entities to differentiate the records on the map. [1]
You can also add your custom pushpin icon by clicking on the plus + You need to select the SVG file. [2]


Cluster Map Records
For all the pins added on the map, there is an option available to cluster them. [1]
By selecting the Cluster option, the pins will get clustered based on the proximity. It will make a group of nearby pins indicating the number of markers. [2]
Note:
On zooming in to the map, number of pins in the cluster decreases and you get to see individual markers on map. (left image) [3] [4]
Whereas, when zoomed out, it consolidates the markers into clusters again.
On clicking any cluster (no. of groups), it will show all the pins in spider cluster form. [5]


Map view Quick options
You will find some quick actions from the header menu of the activity map. The Quick actions are:
– Calendar View
– Heat Map
– Territory Management
– MappyField365 Configuration
– Help
– Full Screen view
It will be easy to perform some action from the map itself, you will not require to navigate the individual options. Quick actions for Heat Map & Territory Management are explained in the individual topics.

MappyField 365 Configuration
You can navigate to the default set up of the MappyField 365.

Help & Full Screen
From the right side on the MappyField365 header, there are two options are provided:
> Help > Full Screen View. [1]
Help
- You will get the Help option regarding the MappyField 365. [2]
Full Screen View
- You can enter the Full screen view. [3]
- By clicking on the ‘Full screen’ icon, the map view will open in the Full screen view. [4]


Multiple Map Views
We provide multiple map views like Road Map, Aerial, and Bird’s Eye for the better understanding.[1]
- Road Map
From the Map, the street side view option is provided to check the street view of the location.
You will get the Street view of Bing maps. [2]
- Aerial Look
Aerial look you can see the detailed view from above. [3]
- Bird’s Eye
With the Bird’s Eye view you have a better angle for the ariel photography. [4]


Advance Options
From the left side of the MappyField map view, there are Advance options are given related to check, manage and configure the records on the map.
– Layer Card
– Save as Template
– Marketing List
– Select Category(Category wise Search)
– Summary Card
– Refresh

Layer Card
With every plotting records on the map, it would show each plotting as Layer menu.
Layer Card (Layer Menu) displays all plotted record of the entities in one place. [1]
From the ‘Layer Card’, you can hide/show the records on the map and visible/invisible the ‘labels’ of the pushpins.
When the records are plotted for more than one entity on the map, you can hide any entity for a while to check and manage plotted records of other entities without removing the entity.
Here the ‘Opportunities’ is hidden from the map. So, you cannot see the pushpins of the Opportunity entity on the map. [2]
By clicking on the Invisible icon of any entity, the icon will turn in to visible and you can view the labels of the records. [3]
By making the ‘visible’ icon of the Accounts, the label (name) of the accounts will be visible on the map.


Save Template
All the plotting data made along with zoom level configurations can be saved as a Template.
By clicking on Save Template icon, a dialog box opens to give a name to the template. Moreover, you can select the box Is Public to make the template public. To save the existing template, click on the Update button. [1]
After inserting the Template name, click on Create new template button to save the template for future reference.
You can check the saved templates from the Templates tab from the header. [2]
To make a default template, click on the + icon, it will be set as default template and when you (or any CRM users) will navigate to the activity map (Map), it will load with the default template records.
By clicking on the view icon, you can view the records of that template on the map. You can also delete any unwanted template by clicking on the delete icon.


Marketing List
Marketing list contain the members like Account, Contact or Lead records. You can add the MappyField 365 data in any marketing list to market the specific segments more effectively.
By clicking on ‘Marketing List’ icon under the “Select Entity” option, you will get the Add to Marketing List popup window. [1]
You can get the “Marketing List” by clicking on Search icon if it has already been created in Marketing -> Marketing List or you can add to a new list by selecting the “Add to a new list”. [2]
Note: At a time only the single entity records can be assigned to the Marketing List.


Category Search
You can perform Category Search on single as well as multiple entities.
Performing this search will list out all attributes of the selected entity. These attributes visible in the category listing dropdown can be managed under the Entity Configurations Next, you need to select attribute based on which record should be plotted. Here, it would show dialog box for attribute selection for each entity. [1]
By clicking on the ‘Search’ button, the data will plot pins as per the selection of attributes. You will get the list of selected categories entity-wise on the right side of the map (Infobox). [2] [3]
You will see the categorized records with the number of records.


Summary Card
Clicking on ‘Open Summary Card’ icon, you can view total number of records and other entity related details plotted on map as configured from the back end.

Refresh
By clicking on the Refresh icon, the MappyField map and plotted records will refresh and load again.

Search Options
You can plot the records of particular entity based on different Search Options.
You can search and plot the records based on five Search Options:
> Region > Drawing > Territory > Proximity > By User

By Region
By region option lets you plot records on the map based on the region of your choice.
The various regions that you can select one from are City, State, Country, and Postal Code. [1]
If you select the State, you need to insert the ‘State’ name for that you need to check the records on the map.
User can also plot multiple regions in map by adding comma (,) separated values. For example: Texas, Tennessee. [2]
Now, by clicking on the Search button, only the inserted states get highlighted on map along with the records that come under that states. [3]
By clicking on any shape, it will display Summary Card for selected shape. [4]
You can see details in the Summary Card of the selected State.
By clicking on the close X icon, the state will deselect.
You can also manage the Territory when the Region search option is selected and records are plotted on the map.
Note: You can create and manage the Territory from the individual option of the “Territory Management”.


By Drawing
You can plot the data by defining your own shapes. By selecting the Drawing search option, the drawing tool will enable you to draw the following shapes: Polygon, Circle and Square. [1]
For free drawing select the ‘Polygon’ shape, just by single clicking on the map drag the mouse cursor the shape will be drawn. You will get the records as per your drawing on the map.
When you draw the shape, you will get the real-time shape measure details as well. [2]
You can edit the drawn shape by selecting ‘Edit’ After selecting Edit icon, you can move the shape and increase/decrease the area of the shape.
You can remove the drawn shape by selecting ‘’Erase” icon and then click on the shape. [3]
You can change the fill color and the outline color of the shape.
The color picker option is given to change the color of both. [4]
You can also manage the Territory when the Drawing search option is selected, and records are plotted on the map.
For free drawing select the Freehand tool with which you can draw the shapes freely on the map and search the records you want.


By Territory
You can also view records on maps based on Territory. By selecting the ‘Territory’ in search option , you will get the list of Territories in dropdown. [1]
Select the Territory/Territories the records of which you want to display on the map.
Now, on clicking Search button, all records that fall under the selected territory will be plotted on map.
Note: This dropdown would show those territories also that are created from created under Territory Management section or from Settings -> Sales Territory -> Business Management. [2]
Note: To select territory, territories should be defined by you along with their territory manager in CRM.
To manage territories, follow these steps: Settings > Business Management > Sales Territories.
Also, territories reflect based on territories created under territory management section.


By Proximity
It lets you view nearby records in proximity from current location based on Distance or Time.
You can define distance either in miles or kilometers as well as time in minutes. [1] [2]
DynamicsCRM user can also search the records using the ‘Proximity Search’ from the mobile or tab. [3]


By User/ Team
You can search and plot the entity records based on Users and/or Teams from the ‘Search Options’. It would plot all records that are created by the individual User or the Team.
By clicking on Search button, the records of the selected user will be plotted on the map.
Note: This search option is available only to users who has admin role.

Map View options
There are many options and actions provided to manage the map records easily from the Map View. [1]
Details on Hover
You can view record name by hovering on any Information shown on hover is completely customizable from the Entity Mapping. [2]


Tooltip Details
By clicking on any specific record (pin), you will get details related to that record based on configured from the backend. By clicking on that, the details of the Slider will open from the right side. [1]
From the records detail card from the slider will let you perform different actions related to the selected record.
For the selected record, you can set the direction by defining the Origin or Destination. [2]
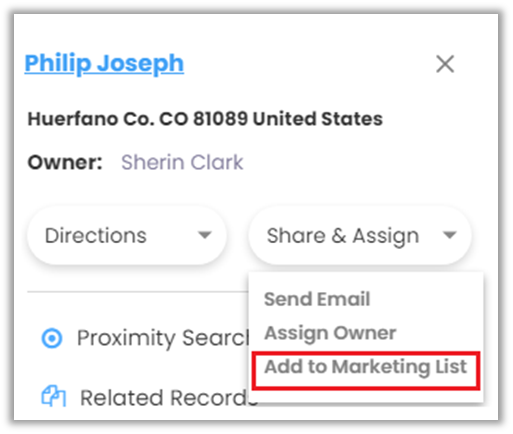
You can Share & Assign the selected records by: [3]
> Sending Email
> Assigning Owner
> Add to Marketing List
Note: These action are present by default on record of every entity and these buttons cannot be changed.
There are some other actions that can be enabled/disabled from the Security Template. [4]
Other Actions :
> Proximity Search
> Related Records
> Point of Interest
> Knowledge Article
> Delete Record
> Related Records
Note: Other than these, there are few actions buttons like Check in and Check Out that are dependent on the selected entity.


Direction
By clicking on the Directions à Add to Origin option, address of that record will be added as starting point in Routes. [1]
From Routes tab you will get address of your customer’s location.
On the map, the ‘Starting Point’ will be assigned as A with the address of that record displayed. [2]
By clicking on the Add to Destination option of the other records, the address of that record will be added as destination point of route under Directions tab. [3]
You can select the Origin and the Destination between the plotted records from the Directions option and manage your route based on that direction. [4]
Click on the GO button to check the routes between selected Origin and Destination on the Map. [5]


Send Email Using Template
From the Share & Assign, you can ‘Send Email’ to the selected record.
By clicking on that action button, it would prompt user to select an email template. [1]
The email templates list would have list of all the templates that are created within the CRM and custom templates as well. You may select from the list or select New email to create a new one. Selecting template would directly perform the mail action if email id is available. While creating a new one would redirect to CRM email screen. [2]
Note: If user to whom the mail is being sent is not operating the email address, then the mail won’t be sent and an error message stating that record’s email address is not active will be displayed.


Assign Owner
From the ‘Share & Assign’, you can Assign Owner for the selected record.
You can assign any record to specific user or team by clicking on “Assign Owner” option from specific user’s details. [1]
Selecting Assign Owner option, it opens a dialog box where dropdown list of all the CRM users is provided to select user or team as required. After selecting the appropriate User/Team, click on Assign button. [2]
Note: When assigning record to a user or team, that specific user or team should have role assigned to it or else record won’t be assigned.


Assign to Marketing List
From the ‘Share & Assign’, you can Assign Owner for the selected record.
You can assign any record to specific user or team by clicking on “Assign Owner” option from specific user’s details.[1]
On clicking, you will have the option to add record either in existing marketing list or create the new one. [2]
After selecting the marketing list, click on the Add button to complete the addition of records to the marketing list.
Note: Assign to marketing list icon under map section, will assign all records of particular entity to the list. Also, it will get assigned only when records of single entity are plotted on map.

Proximity Search
From the detail cared of the selected record, Proximity Search lets you to view nearby records in proximity of the selected record based on time or distance. [1]
You can define distance either in miles or kilometers as well as time in minutes.
You can also perform concentric proximity search based on distance with three different values.
Here on defining search criteria of 75, 85,95 Miles, it will plot records situated in 75, 85, 95 Miles area from current pin location.
Also, you can search in proximity from single entry as well. [2]
On hovering over pin, you get details as configured along with travel distance in case of search based on distance. And travel time in case of search based on time. [3]
Note: When proximity search is to be done on basis of time, at max you can define 85 minutes.


Related Records
By clicking on “Related Records” icon, all related records to the plotted record get plotted on the map. [1]
Here, as there were three contacts associated with the account, all three of them will get plotted on the map. [2]


Point of Interest
You can search for nearby attractions, hotels, airports, restaurants, coffee shops, gas stations, etc. from the Point of Interest.
It will take the address of the selected record as POI location to search nearby places. [1]
After selecting the specific Point of Interest options, click on the GO The selected POI options will plot on the map. [2]


Knowledge Article
You can check the Knowledge Article which is shared with the selected record. [1]
By clicking on the Knowledge Article, you will navigate to the ‘Active Articles’ page. [2]


Create New Activity
You can create a new activity for a record by clicking on “Create New Activity” icon associated with specific record. For example lets create an appointment. [1]
Select the Appointment from the select activity and fill the required fields to create an appointment. [2]
Appointment should have a subject and time details.
The appointment that is added can be viewed in detailed view of record in Dynamics CRM.


Delete Record
- By clicking on delete button, selected record from map gets deleted from the CRM.

Qualify/Disqualify Lead
By clicking on “Qualify Lead” icon, status of lead will get updated to close state and user will be redirected to opportunity page from the map. It is available only for record of lead entity. [1]
Note: Open leads will display option to qualify/disqualify lead. Once leads are qualified, those leads will be shown in Closed Leads view.
Disqualify Lead
By clicking on “Disqualify Lead” icon, leads will get disqualified and its status will be changed to close. [2]
Also, upon disqualifying lead, user needs to select the reason for disqualifying lead. Reasons can be like Lost, Cannot Contact, No Longer Interested and Cancelled. It is available only for lead entity. After you select reason click on Disqualify button to complete the action. [3]
Disqualified leads can be reactivated by clicking on Reactivate Icon present with closed lead record.
Reactivate Lead
By clicking on “Reactivate Lead” icon, leads will be reactivated, and its status will be changed to Open.
Note: On reactivating lead, view of lead will get updated from closed leads to open leads.


Direction
Once you add the records to ‘Origin’ & to ‘Destination’, you can check in to the Routes From here by clicking on the GO button, you will get the route navigation with details.
From the Route tab, you can also add multiple address and get directions. You can reverse the direction by clicking on this “↑↓“icon. [1]
On the Map, you will get directions based on Driving including alternate direction if any. [2]
You can add multiple way points by clicking on ‘Add Destination’. You can add a maximum of 25-way points. [3]


Multiple Routes
By clicking on any location or plotted records, click on Add to Destination to add multiple way points or you can add manually by clicking on the Add Destination from the ‘Routes tab’. As you add all the required location and click on GO button, you will get the routes based on the location of multiple way points. [1]
For all the waypoints added in the route, each way point can be dragged to reorder their position in the route.
After reordering the route, it will immediately reflect on the map also. [2]
You can select the time at which the generated route is going to be used by you.
For that click on Leave now option. [3]
By clicking on Leave Now, you will get Leave now, Leave at, and Arrive by options.
Select the date and time when you want to travel. [4]
Arrive by option is only available when there are only Origin and Destination locations set. [5]
After selecting the location between Origin and Destination, it will list all possible routes and highlight the optimized route.
You can also get directions based on means of transport like Public Transit and Walking. [6] [7]


Asset (Trucks)
If you have configured the “Asset” (truck) and managed, you can add the truck’s route to transport the items. [1]
Once you add the waypoints (starting-ending points), click on the ‘truck’ icon to select which truck is required to transport the items. By clicking on the ‘truck’ icon, you will see the Asset Details popup from where you can select the truck and manage other details as well. [2]
You will see the list of the truck that are added from the Asset in the “Truck Type” drop-down. [3]
Once all the asset details are configured, click on Go button to get the route to transport the items.
")


Email Route
As you click on the ‘email’ icon, the Email page in CRM side will open with the link of selected route. You need to insert the account/contact details to whom you want to send the email. [1] [2]
You can see the preview of the email. As per the preview, the route details will be shown in the tabular format in the email. [3]


Save Route
Also, the selected route can be saved for future reference. To save a route, click on the Save icon available on the top. [1]
By clicking on Save icon, it opens a dialog box where you need to provide a name to the route and user/team name to whom the route is being assigned.
Along with this, you can also define route date and priority. Priority can be set from Low, Normal and High.
By clicking on the Save button, you will be navigated to the Saved Schedule (Saved Routes). [2] [3]
You can preview the routes and delete any if it is not required. Routes can also be filtered based on Start date and End date by clicking on the “Filter” icon
You can also apply various filters on route by clicking on “Options” dropdown. Various filters related to Distance are: [4]
– Miles/KM
– Directions: Shortest Time/ Distance
– Avoid Highways
– Avoid Tolls
– Avoid Ferries
– Along the Route Search
Selecting Along the route search option prompts user to enter search radius and its unit.
By default, it can be managed from the configurations. This would search records within the given radius of plotted route and displays pin in different colors than that which are within the route.


SPF (Shortest Path First)
If Route optimization is enabled from Configuration, then it will short the added routes with SPF algorithm. It can rearrange route according to their distance from each other. [1] [2]
Note: If you have enabled the SPF from the Default Configuration, only then SPF algorithm gets applied on the route.


Templates
Templates feature helps you save map configurations so that you can come back to them later and tweak them according to requirement.
If you’ve selected Is Public for the Template at the time of saving, it will be visible to all CRM users of AppJetty MappyField 365. [1]
Note: If template is not public, only admin and the user who created that template will be able to view it.
Under Templates section, logged in users can see all the templates created by them or the templates that are made public. [2]
The templates can be previewed by clicking on View icon or You can delete as per your requirement. [3]


Add New Location
You can add the important location like property, land inquiry purposes, from the map by right-clicking on that specific location → Add Locations. [1]
By clicking on the Add to Location, Add New Location popup will appear. The Zoom level will be selected as per the Map view and enter Location Click on “Save” button to add location. [2]
You can check the important saved locations from the Locations tab and edit/delete the locations as per your need. [3]


Live User Tracking
Being an administrator of Dynamcis365, you can check live location of your team (users).
If you have configured the Firebase in the MappyField 365, you can access the Live user tracking (for the users or resources). You can track all CRM users which are logged in on MappyField 365.
For that navigate to the Dashboard Configuration from the MappyField left side navigation pane.

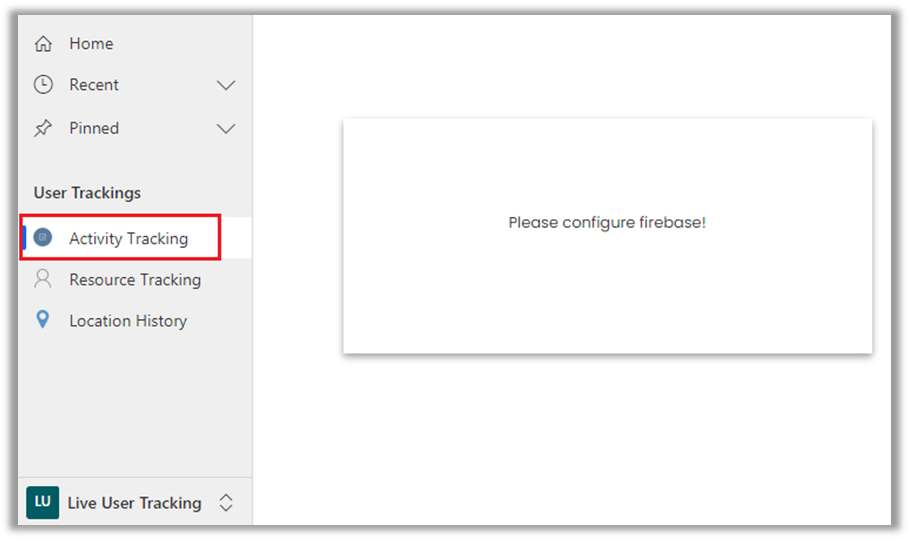
Activity Tracking
By clicking on the ‘Live User Tracking’, you will navigate to the Activity Tracking. [1]
Select the user(s) from the User list and select the date on which you want to check the visited location.
You will get the Map & Timeline View to check the tracking on the map and the selected user(s) timeline. [2]
By clicking on the Start Tracking, you will get the details of the user’s current activity on the map. [3][4]


Resource Tracking
Select the users to track them. By selecting the Users and click on Search button, User tracking details can be seen on the map. [1] [2]
Note: Following conditions needs to be fulfilled in order to track user’s location.
– Configure the Firebase to enable user tracking in the MappyField 365.
– Track User Option only visible to admin user.
– User must have MappyField 365 role or able to access MappyField 365 and must be logged in to MappyField 365.
– User must allow location access from mobile or web through which user is using MappyField 365.
– MappyField 365 must be open in order to track user’s location.
– In Every 5 Mins, Users’ location will be updated.


How to configure the Firebase?
We must configure the Firebase for “Live tracking”. Follow the below steps:
- Go the Firebase website, open this link: https://console.firebase.google.com/
Here you need to add a new project by clicking on the + Add project.
Give a suitable name to your project and click on Continue to configure the details.
In next, you will find the “Add Firebase”, click on that.
By click on that, the project will be created.
Click on Continue for next details.
Click on </>
Now register the app by inserting the relevant name to web app.
After registration the web app, you will get the script which you have to copy the code and you must enter in MappyField 365 configuration for live tracking.
Click on Continue to console.
In this way, by configuring the Firebase and copy the code into the MappyField 365 configuration, you can enable the Live User tracking feature.


POI-Point of Interest
If you want to search specific locations like restaurant, coffee shops, hotels, airport, gas station, etc. near the plotted records, click on Point of Interest tab.
You must insert the location; the autofill dropdown will appear. You will get the POI location bases on your location. [1]
Under the POI tab, select the location/place which you want to search.
After selecting the POI Location, click on the GO button to plot the records of the POI on the map. [2]
From the “Layer card”, you will get the POI Layer and you can also check the POI locations in detail from the “Details cards” on the right side of the map. [3]
You can also add any POI Layer record into the Route (direction). From the right side popup window, you will get the ‘Direction’ icon, by clicking on that, the POI record will add to the Route. [4]
By clicking on the direction icon, the record will be added into the Route. [5]
You can set any POI Layers and set the route to your CRM record.


Data Grid
Data Grid provides listing of records which are plotted on the map. You can perform the different actions and manage the records from the Data Grid.
To view the plotted records in the data grid, click on Show Data. [1]
By clicking on Show Data, a slider will open. You can view the plotted data as per selection of Entity. In the dropdown list, you will get only those entities which are selected to plot the record on map. [2]
- You can get the records of a specific entity by selecting the Entity View. [3]
- You can Search the records by inserting Name or Address.
- The records will display as per the selection of the ‘Entity View’.
- Copy the records, export the records in a specific file (Excel/PDF) and direct print the records.
- Perform the different actions by selecting the data grid records: [4]
> Add Record To Route > Change owner > Add Task > Add Appointment
> Send Email > Manage Territory > Schedule Records
By clicking on View icon , that record will get opened in CRM. By clicking on Delete icon , it deletes the respective record from the CRM.
You can perform actions by selecting records within the data grid as shown below:


Add Record to Route
Select the records and click on the “Add Record to Route” icon to add the records to the route. [1]
By clicking on that icon, the ‘Routes’ tab will appear with the selected records of the data grid.
The locations will be added based on the record selection in Data Grid. [2]
Note: If you proceed to perform any action from data grid without selecting any record, you will get the Alert message that will prompt you to select the record.


Assign to User/Team:
You can directly assign the selected record to the User/Team.
As you click on that icon, the Assign to User or Team popup window will open to select the User/Team. [1]
After selecting User/Teams, click on the Assign button. [2]
Add Activity:
You can add the Task of selected records by clicking on Add Task icon. [3]
As you click on that icon, the Add Task popup window will open to insert the Task-related details. [4]
After clicking on Create button, Task will be added. [5]
Similarly, you can add the ‘Appointment’ of selected records by selecting the Appointment activity from the drop-down action.


Send Email Using Template
Send Email by selecting the records.
As you click on Email icon, the Send Email popup window will open. You need to select the Email Template. [1]
By selecting an email template, you can send the Email on the email ids of the selected records.
By clicking on Send Email button the email page will be redirected. [2]


Manage Territory
From the Data Grid, you can add your selected records in the specific Territory.
As you click on Territory icon, the Mange Territory window will open. [1]
You need to select the Territory and after that click on Save button. [2]
Here you will get the dropdown list of the Territories as per Adding and Managing Territories.


Auto Schedule Records
You can auto-schedule the selected records by clicking on this icon. [1]
As you click on it, the warning message will appear that just inform that the plotted records will be cleared on the map. [2]


Auto Schedule Records
You will find the Auto Schedule Records option only from the ‘Data Grid’. Select the required data from the Data Grid and click on Auto Schedule icon. [1]
Once you clicked on Auto Schedule icon, you will get a Warning message regarding the removing the plotted records from the map. [2]
By clicking OK, you will be redirected to “Auto Scheduling” slider from the right side.
In map configuration Auto scheduling configuration will be there according to set values.
To create an Auto Scheduling, fill the required data. [3]
> Time Period: Select Time duration, Total working days/week/month. (Mandatory field)
> Start Location: Insert your starting location from where you want to start the schedule. (Mandatory field)
> End Location: Insert your ending location where your scheduling end.
> Time Period: Select day/days for Auto Schedule.
> Meeting Duration: Select the time for each plotted record for meeting or appointment. [4]
> Schedule Start Time: Select Starting Time of the day.
> Schedule End Time: Select Ending Time of the day.
> Break Start Time: Select Break Start time in between scheduled time.
> Break end time: Select Break End time in between scheduled time.
> Extra/Buffer Time : Select time for a day for extra work. [5]
> Working Days: Select days for working. You will get the date wise schedule as per selection of Time Period and you will get the date wise schedule as per selected days. [6]
- If your activity is starting from date of 22nd Oct (Thu.), Time period is 4 days and selected Days are: Monday, Tuesday, Thursday, and Friday. You will get the date as per the selection of the days. Wednesday will be skipped.
- You can save the schedule by clicking on Save Schedule. [7]
- By clicking on the Schedule, the Routes will auto schedule on the map.
- Here, you will get the direction based on SPF algorithm. [8]
- As you click on Save Schedule button, the Save Schedule popup will appear. Enter ‘Route Name’ and ‘assign’ it to user by selecting user from the dropdown. [9]
- You will get the Saved Scheduled Routes under the Direction tab.
- You can view the Routes by clicking on view You can even Delete and Edit the routes by clicking on the Delete and Edit icons. [10]


Contextual Menu
‘Right click’ on to map to open Context Menu.
It provides options as below:
> Create New Record > Show Detail > Add Task > Add Appointment > Add to Route
Add to Locations > Set as POI Location > Set As Current Location.
You (or logged in CRMusers) can also set default settings by hovering on Save Settings option:
> Default Location > Map zoom level > Origin > Destination.
These settings directly get saved under MappyField 365 Configuration record for logged in user.
By selecting Create New Record Option, open a dialog box to select record type.

Create New Record
It can be Account, Contact or Lead. Upon selection of the option, you are redirected to a particular entity page of record creation.


Show Detail
By clicking on the Show Detail option from the Context Menu, you will get the popup window of the ‘Public Details’ from the right side as per the location. [1]
You will get the address details of the location. You can search the POI places and get the direction from the selected location. [2]


Create New Activity
From the Context Menu, you can directly add a Task and an Appointment.
You can add the activities that are enabled from the CRM backend. By clicking on the Create New Activity, “Create Activity” popup will appear. [1]
By clicking on the Add Task or the Add Appointment, the popup will appear to select the required details to add Task or Appointment. [2]
Similarly, you can perform the actions for other options from the Context Menu. [3]


Calendar View
You can also view the plotted records in the calendar view along with the Map view. [1]
You can view the calendar on a daily, weekly, and monthly basis.
On clicking the activity from the calendar view, it will give the details of that record. [2]
After clicking you can also see the summary card which will have the details of that activity. [3]
You can also view the calendar in full screen by clicking on the full-screen icon. [4]
You can also reschedule the activity by dragging and dropping to a particular date. [5]
After dragging and dropping the activity a warning message will popup on the screen. Click on OK to re-schedule the activity. [6]
Activity updated successfully message will appear on the screen. [7]
Note: The time of the activity will be the same as it was before rescheduling.
You can reschedule the time of the activity from the Daily view by dragging and dropping as per the requirement. [8]
Activity updated successfully message will appear on the screen. [9]


Heat Map
Get the aggregated visualization by selecting the data sources of any Entity to check the statistical data. You will have two options to access the Heat Map:
-> A quick access option from the Map itself.
-> Individual Heat Map from the MappyField 365 navigation pane on the left side.

Quick Access Heat Map
You will find the Heat map ‘Quick’ access option besides the Menu of the MappyField 365. [1]
By clicking on the ‘Heat Map’ icon, a Heat Map will open as Quick access view. Here, the Heat Map will load with default plotted data as per the default template.
You can enter the Heat Map in the Full screen by clicking on Full view icon besides close x icon. [2]


Heat Map Navigation
By clicking on Heat Map from the navigation panel, the Heat Map page will be open and load with plotted records as per the default template selection.
You can plot records of the Entities on the Heat map that are already configured in “Entity To Map”. [1]
It would open a map for you to select further map options. Here, it would list all those entities that are configured under Entity Mappings.
- Different options are:
– Select Data source: Choose entity and its view to analyze data.
– Select Measure: Select the aggregation method to be used to color code the region. By default, it would be based on number of records.
– Select Filter: This option lets you select category to filter data results.
– Select Display: You get four different options to analyze data on heat map. Options are: [2]
– Boundary: This creates heat map based on selected region type. [3]
– No Boundary: This option creates heat map based on density of the measure selected without geographical boundaries. [4]
– Pie Chart: View data in form of pie charts based on attributes selected in measure & filter. [5]
– Column Chart: View data in form of column charts based on attributes selected in measure and filter. [6]
– Select Region Type: Define geography level of aggregation. It can be any from the city, state, country, and postal code.
Note: On hover, it shows details of the boundary, pie chart or column chart attributes and clicking on a specific highlighted region shows up the summarized information for the same.


Heat Map Templates
Once all the Heat Map is generated by selecting the Data sources of any entity, you can check the records in the Summary Card and save the heat map as a template. [1]
By clicking on the ‘Summary Card’ icon, you will get the total records with the data source details.
By clicking on the ‘Save’ icon, you can save the Heat map as a template for future use. [2]
If you want to replace with existing Template, click on the Update button, that will be replaced the heat map with new data sources.
To create a new template click on the Create new template button and it will be saved as template. [3]
By selecting the Is Public option the template will be shared with other team members (CRM Users).
The template that is assigned as a default template will appear in the ‘Template’. If you click on the Update button, it will replace with a heat map of the default template.
Now, by clicking on the ‘Templates’, you will get the list of the saved templates of the different heat maps.
To make a default template, click on the “+ ” icon, it will be set as default template and when you (or any CRM users) will navigate to the Heat map, it will load that default template. [4]
By clicking on the view icon, you can view the data source of that template on the heat map. You can also delete any unwanted Heat Map template by clicking on the delete


Territory Management
Create the new territories or manage existing territories to define regional/area based activities from the Map.
You can plot regions on map based on files, by location of regions, and by drawing. Based on plotted regions, you can use the Alignment tool to select the required regions and create new territories. Also, you can plot the existing territories and copy or move them as required.
You will have two options to access the Heat Map:
-> A quick access option from the Map itself.
-> Individual Territory Management from the MappyField 365 navigation pane on the left side.

Quick Access Territory Management
You will find the Heat map ‘Quick’ access option besides the Menu of the MappyField 365. [1]
By clicking on the ‘Territory Management’ icon, a Territory Management will open as Quick access view. From here you can create territory & manage it.
You can enter the Territory Management in the Full screen by clicking on ‘Full view’ icon besides close x icon. [2]


Territory Management
To perform territory management, click on the Territory Management from the MappyField 365 navigation pane. [1]
Different search options available are By Region, By Drawing, By Territory, By File.
- By Region: This option helps users to search for regions on the map i.e. City, County, State, Country and Postal Code.
- By Drawing: This lets you draw a shape using custom drawing tool:
Union, Union Aggregate, Difference, Intersection, Disjunctive Union. You can perform the actions like: Undo, Reset and After performing shape operation user can create new territory of that resulted shape.
- By Territory: Using this option, you can plot existing territories on the map.
- By File: This option helps in plotting shape files. Supported file types are .shp, .kml, and .geojson. You can also upload the CSV file of any region/location to create and manage the Territory. [2]
After plotting, using territory alignment tool, you can select/deselect territories as required on the map. Using alignment tool, you can select/deselect, remove selection or refresh the map. [3]
Create New Territory: Select region/shape and right clicking on selected region, it would show option to create new territory. Clicking on Create New Territory would open a dialog box to enter territory name and select manager for a territory.
Here you will get the statics of the Accounts, Contacts & Leads under the No of Records. [4]
Combine with existing territory: You can also choose to add the new territory within existing territory by selecting “Combine with existing territory” option. After inserting new territory or selecting the existing one, click on Save button. [5]
You can also create and manage the Territory using By Drawing option. [6]
You can add a new territory by clicking on the ‘Create New Territory’ or you can add to existing territory by selecting ‘Add to existing territory’ option. After inserting new territory or selecting the existing one, click on Save button. [7]


Manage Hierarchical Territory
You can create any territory using the required search options. After selecting the plotted area, right-click on it and you will see the Create New Territory option.
By clicking on the “Create New Territory” option, you will see the + Create new territory popup with mainly three options to manage the territories: [1]
- Add to parent territory: You can add the plotted area (new territory) under any territory (existing territory) that will be a parent territory.
- You need to insert the relevant “Name” of the new territory. After that, you need to “Select Territory” which will be the parent territory for the new territory.
After clicking on the Save button, the new territory will be created and placed under the parent territory (selected territory). [2]
Once the territory is created, you and the CRM users can see the parent-child structure in the search options to plot the territory on the map. [3]
You can plot the territories on the map for the Parent and its sub territories separately. [4]


Assign Parent Territory
After right-clicking on the existing territory, you will see three options as follow:
– Assign Parent Territory
– Copy To
– Move To
You can assign parent territory to any existing territory from the territory map itself. Once you plot the territory using the “Territory” search option, select that specific territory using the selection tool. [1]
By clicking on the “Assign Parent Territory”, you will see the popup named + Assign Territory. You need to select the parent territory from the drop-down selection. [2]
By clicking on the Save button, the selected territory will be assigned as a sub-territory of the selected territory from the “Assign Territory” popup. [3]
By moving the mouse cursor over the area, you will see the parent and sub-territory. [4] [5]


Copy Or Move Territory
You can also manage the existing territory by copying or moving to another of any search options. [1]
Copy/Move Territory: Right clicking on selected region/shape that is an existing territory, it would show option to copy or move territory. [2]
Clicking on Copy to/Move to would open a dialog box to select if territory must be copied/moved to an existing territory or create a new one. [3] [4]
In case you are moving/copying the territory by creating a new one, it would ask to enter territory name followed with manager selection for the territory.


By File
You can plot the territories by selecting the shape files with supported extensions .shp, .kml, and .geojson. You can also import the CSV file or create CSV file as per the sample file. [1]
You can download the Sample CSV File and update the details in the CSV file. [2]
Once you update the details in the CSV file, by importing on the map, it will display the Territory. So you can create and manage the plotted region/area as Territory.


Draft Territory
If you want to create a new territory, you can save it as a draft for a while. You need to insert relevant “Territory Name” and “Select Manager” from the drop-down selection.
Note: If you select the “Create new territory”, only then you will get the Save As Draft button. [1]
By clicking on the Save As Draft button, the territory will be saved as a draft.
You can see the draft territory by clicking on the Draft Territory tab from the header of the Territory Management page.
You can perform the actions for the draft territory. [2]
– View: You can view the draft territory by clicking on the ‘view’ icon.
– Add: You can save the draft territory by clicking on the ‘+’ (add) icon and it will be added to the territory list.
– Delete: You can delete the draft territory by clicking on the ‘delete’ icon.


Shape Operations
For drawing shapes plotted on map, user can select shapes that are drawn using drawing tool and right click on them to select binary operations.
There are five different shape operations available:
> Difference > Intersection >Union > Union Aggregate > Disjunctive Union.
Note:
- Shapes should overlap each other for performing shape operations. In order to perform binary operation, shapes should be selected.
- Move To/Copy To works on shapes of plotted territories.
- Create & manage the Territory from the “Map” (activity map) if you have plotted the entity records using “By Region” or “By Drawing” search option.

MappyField 365 inside entity record
You can enable the map of the MappyField 365 for an individual CRM entity record. You will get the records on the map inside the specific entity record from the DynamicsCRM backend side.
For that you need to configure the “Form” and the “Web Resources” for the entity. You need to follow the below steps to configure the map view inside the individual entity record details:
Navigate to the DynamicsCRM Settings à You will find the “Customize the System option” to create & modify the entity components. [1]
- By clicking on “Customize the System”, a new browser tab (Power Apps) will open to configure the components. [2]
- Click on the Entity (i.e. Account) → ‘Forms’ to configure the map for the individual record.
- Insert the Tab as per the layout that you want to be displayed. e. One Column. It will add a tab to the entity form. [3]
- Once the new tab is inserted in the entity form, double click on the tab, a “Tab Properties” popup will appear. [4]
- Insert the “Name” & “Label” for the form and press OK button.
- Add “Web Resource” to the form that will display the map inside the tab of the entity record. [5]
- Now, click on the “Web Resource” (double click), to configure the properties. Select the Web resource from the Lookup Records. Insert Web resource, Label, Name. [6]
- Select bzmap_recordmap as Web resource. [7]
- You need to select the “Formatting” for the Layout to adjust the calendar in the proper format. [8]
- Now, Press OK to save the properties and then navigate to the entity record (account entity), you will find the dynamic map for the individual entity (Account) record.
- You will get the new tab as configured. By clicking on it, you will get the dynamic map. You can check the map records for the individual entity records. [9]


Data Grid
Data Grid provides listing of records which are plotted on the map. You can perform different actions and manage the records from the Data Grid.
To view the plotted records in the data grid, click on Show Data. [1]
By clicking on Show Data, a slider will open. You can view the plotted data as per selection of Entity. In the dropdown list, you will get only those entities which are selected to plot the record on map. [2]
1) You can get the records of a specific entity by selecting the Entity View.
2) You can Search the records by inserting Name or Address.
3) The records will display as per the selection of the ‘Entity View’. [3]
4) Copy the records, export the records in a specific file (Excel/PDF) and direct print the records.
5) Perform the different actions by selecting the data grid records:
> Add Record To Route > Change owner > Send Email > Add Task > Add Appointment [4]
By clicking on View icon, that record will get opened in CRM. By clicking on Delete icon , it deletes the respective record from the CRM.
You can perform actions by selecting records within the data grid as shown below:


Send Email Using Template
Send Email by selecting the records.
As you click on Email icon, the Send Email popup window will open. You need to select the Email Template.
By selecting an email template, you can send the Email on the email ids of the selected records.
By clicking on Send Email button the email page will be redirected.

Add Task & Appointment
You can add the Task of selected records by clicking on Add Task icon.
As you click on that icon, the Add Task popup window will open to insert the Task-related details. [1]
After clicking on Create button, Task will be added.
Similarly, you can add the ‘Appointment’ of selected records by clicking on the Appointment icon. [2]


Assign to User/Team
You can directly assign the selected record to the User/Team.
As you click on that icon, the Assign to User or Team popup window will open to select the User/Team. [1]
After selecting User/Teams, click on Assign button. [2]


Add Record to Record
Select the records and click on the “Add Record to Route” icon to add the records to the route.
By clicking on that icon, the ‘Routes’ tab will appear with the selected records of the data grid. [1]
The locations will be added based on the record selection in Data Grid. [2]
Note: If you proceed to perform any action from data grid without selecting any record, you will get the Alert message that will prompt you to select the record.


Refresh
By clicking on the Refresh icon, the MappyField map and plotted records will refresh and load again.

Summary Card
Clicking on ‘Open Summary Card’ icon, you can view total number of records and other entity related details plotted on map as configured from the back end.

Save Template
All the plotting data made along with zoom level configurations can be saved as a Template.
By clicking on Save icon, a dialog box opens to give a name to the template. Moreover, you can select the box Is Public to make the template public. To save the existing template, click on the Update button. [1]
After inserting the Template name, click on Create new template button to save the template for future reference.
You can check the saved templates from the Templates tab from the header. [2]
To make a default template, click on the + icon, it will be set as default template and when you (or any CRM users) will navigate to the activity map (Map), it will load with the default template records.
By clicking on the view icon, you can view the records of that template on the map. You can also delete any unwanted template by clicking on the delete icon.


Templates
Templates feature helps you save map configurations so that you can come back to them later and tweak them according to requirements. [1]
If you’ve selected Is Public for the Template at the time of saving, it will be visible to all CRM users of AppJetty MappyField 365. [2]
Note: If template is not public, only admin and the user who created that template will be able to view it.
Under Templates section, logged in users can see all the templates created by them or the templates that are made public. [3]
The templates can be previewed by clicking on View icon or You can delete as per your requirement.


Direction
Once you add the records to ‘Origin’ & to ‘Destination’, you can check in to the Routes tab. From here by clicking on the GO button, you will get the route navigation with details. [1]
From the Route tab, you can also add multiple addresses and get directions.
On the Map, you will get directions based on Driving including alternate directions if any. [2]


Multiple Routes
By clicking on any location or plotted records, click on Add Location to add multiple way points or you can add manually by clicking on the Add Location from the ‘Routes tab’. As you add all the required location and click on GO button, you will get the routes based on the location of multiple way points. [1]
You can add a maximum of 25-way points.
You will also get the directions from the Routes Panel. [2]


Map view Quick options
- MappyField 365 Configurations
- Help
- Full-Screen View
It will be easy to perform some action from the map itself, you will not require to navigate the individual options.

Help & Full Screen
From the right side on the MappyField365 header, there are two options provided:
→ Help → Full-Screen View. [1]
Help
You will get the Help option regarding MappyField 365. [2]
Full-Screen View
You can enter the Full-screen view. [3]
By clicking on the ‘Full screen’ icon, the map view will open in the Full-screen view.


MappyField 365 Configuration
You can navigate to the default set up of the MappyField 365.

Select Entity
By clicking on the Plot, you can plot multiple records by selecting different entities. [1]
First, select Entity from the ‘Select Entity’ dropdown option. You will get the dropdown list of entities as mapped in Entity Mappings configuration. [2]
Select View from the ‘Select Entity’ dropdown option. [3]
After selection of ‘Entity’ and its ‘View’, you can Filter the attributes and plot the specific records of the selected attributes from the Filter option. [4]
By clicking on the ‘Filter’ icon, a popup will open to select the attribute of Account entity to plot the records based on the attribute selection. [5]
Note: You can plot the records on the map based on the attribute selection that are configured from the option of ‘Entity Mappings’ in the Data Filter Attributes option.
Once you have selected the Attribute, you need to insert its value. After selecting the attribute and inserting its relevant value to filter the records, click on the Save button. [6]
Now, click on Search button to plot and view the records of the selected entity on map. [7]
All the records of the ‘Accounts’ are plotted on the Map which is highlighted in the red pushpin. [8]
In this way, you can plot the records by selecting the Entity and its attribute in the View. The records will be plotted as per the filtered attributed as you have selected the Filter option for the Entity.
The multiple entities selection option is also given to plot and view the multiple records on the map.
To select another ‘Entity’, click on + Add Legend text caption. As you click on it, the “Select Entity” option will be added. [9]
Now, select another Entity and select its View then click on Search button. You can also filter the attributes of the selected entity to plot the records on the map. [10]
You can plot the records by selecting multiple entities, but you can select a maximum of 5 Entities at a time.
On the selection of more than one entity, pins with different colors get plotted based on the records of entities. On map, Accounts are plotted in red pin and Leads are plotted in green pin. [11]
If entities like Account, Contact or Lead are mapped under the ‘Entity Mappings’ configuration, only then you can select those entities and plot the records on the map.


Pin Selection for Records
Every time when you add a new entity the pin will be added with different color.
Multiple pin options are also available to differentiate multiple entity (legend) records, options will be listed by clicking on the existing pin.
You can change the pin color and its shape by clicking on the pin of any entity. Select different pins for the multiple entities to differentiate the records on the map.

Cluster Map Records
For all the pins added on the map, there is an option available to cluster them. [1]
By selecting the Cluster option, the pins will get clustered based on the proximity. It will make a group of nearby pins indicating the number of markers. [2]
Note: On zooming in to the map, number of pins in the cluster decreases and you get to see individual markers on map.
Whereas, when zoomed out, it consolidates the markers into clusters again. [3][4]
On clicking any cluster (no. Of groups), it will show the entity records in the cluster. [5]


Check-Ins/Check-Outs
You can use check-in and check-out features in all activity entities.
Check-In feature enables admin/user to keep track of exact time spent behind an activity.
With the help of check in/check out button, you can tag geo-coordinates of the location and time while starting and completing an activity.
To perform check in, click on check-in icon available on the info card of an activity. [1]
Once checked in, it would show action button to check out and show Check In/Check-Out History. [2]
Users can Check-In or Check-Out from the map by clicking on the activity or from the detail view of activities by clicking on the title activity name.
If the user is checking in late then the Reason for late check in field will be visible where the users can enter their reasons for being late. [3]


Approve Check Ins
Admins can approve these late check-ins by navigating to Check-Ins – Check-Out section. From the drop-down list select the Pending Check-Ins and you will get the list of all the pending check ins. [1]
There are two ways to approve the check-ins, either you can do it individually or bulk.
To approve individually click on the particular check in and roll down to Check In Status. Select Approve or reject as per your requirement and click on the Refresh button to save it. [2][3]
Note: Once the status is saved you can’t change it.
Bulk Edit
Select the records and click on the Approve button to approve the check-ins. [4]


Approved Check Ins
Once the Check-ins are approved it will be displayed in the Approved Check-Ins page.

Check Outs
Once you have successfully checked in or approved check in, Check out button will be visible in the Info card of the activity. [1]
Click on the Check out button and Fill the following list of details in case of late check out: [2]
Reason for late checkout: Enter the reason for late checkout.
Title: Enter the title for the reason.
Enter a note: Enter the note as a reason for late checkout.
File Name: Upload the file if you want to share any attachments.
Click on the Checkout button.


Approve Check Out
Admin can approve these late check-outs by navigating to Check-Ins – Check-Out section. From the drop-down list select the Pending Check-Outs and you will get the list of all the pending check outs. [1]
To approve individually click on the particular check out and roll down to Check Out Status. Select Approve or reject as per your requirement and click on the Refresh button to save it. [2]
Note: Once the status is saved you can’t change it.
Bulk Edit
Select the records and click on the Approve button to approve the check-outs. [3]


Approved Check Outs
Once the Check-outs are approved it will be displayed in the Approved Check-outs page.

Rejected Check Ins and Check Outs
Any rejected Check-ins and check-outs will be displayed under Rejected Check-Ins and Rejected Check-Outs view respectively. [1]
The users won’t be able to check in or check out if the admin has rejected their request. [2]


Analytical Dashboard
The dashboards are provided in the left navigation panel from the MappyField 365.
There are six different MappyField 365 dashboards:
> Overview Dashboard
> Sales Activity Dashboard
> Sales Performance Dashboard
> Service Activity Dashboard
> Reporting Dashboard
> Custom Dashboard


MappyField 365 Overview Dashboard
You will get the MappyField 365 Overview Dashboard with following dashlets:
> Activity Planner > Schedule > Todays Follow-up Cases By Priority > Top 10 Opportunities
- Activities Planner: It displays activities like Task, Appointment, Service Activity of current month in map related to activities related to account/customer. [1]
- Schedule: It displays all saved auto scheduled routes with date filter. By default, you can see the schedule route as per the current. Users filter is only available for admin users. [2]
- Today’s Follow Up Cases by Priority: It displays all the cases that are to be followed upon for the current day. [3]
- Top 10 Opportunities: It plots top 10 opportunities based on revenue. Opportunities shown are bifurcated based on their stages like Qualify, Develop, Propose. [4]


MappyField 365 Sales Activity Dashboard
By clicking on MappyField 365 Sales Activity Dashboard, you will get the Dashboard of Sales Activities with following dashlets:
Lead By Source > Open Leads > Sales Pipeline > Top 10 Invoices
- Leads by Source: It will display all open leads based on their source creation. It can be an Advertisement, Employee Referral, External Referral, Partner, Public Relations, Seminar, Trade Show, Web, Word of Mouth and Other. [1]
- Open leads: It will display all open leads for the current month. [2]
- Sales Pipeline: It will display all open opportunities based on the revenue. Opportunities shown are bifurcated based on their stages like Qualify, Develop, Propose. [3]
- Top 10 Invoices: It will display Top 10 Invoices with respect to total amount of the invoice.


MappyField 365 Sales Performance Dashboard
- By clicking on MappyField 365 Sales Activity Dashboard, you will get the Dashboard of Sales Activities with following dashlets:
> My New Accounts This Month > Won/Lost Opportunities This Month > New Leads This Month
- My New Accounts This Month: It will display all open leads created this month. [1]
- Won/Lost Opportunities This Month: It will display all Won/Lost opportunities this month. [2]
- New Leads This Month: It will display new accounts created for the month. [3]


MappyField 365 Service Activity Dashboard
By clicking on MappyField 365 Service Activity Dashboard, you will get the Dashboard of Service Activities with following dashlets:
> Cases Reported Today > Cases Resolved Today
- Cases Reported Today: This dashlet would show all the cases reported on a particular day for the currently logged in user. It can be further filtered based on origin, priority and type.
- Cases Resolved Today: This dashlet would show all the cases resolved on a particular day for the currently logged in user. It can be further filtered based on origin, priority and type.
Note: Dashboard will show data only if respective entity is mapped and has records. In case of customer related entities, it is mandatory to map accounts or contacts entity to view records in map. User can redirect to records directly from the dashboard.


MappyField 365 Reporting Activity Dashboard
By clicking on MappyField 365 Reporting Dashboard, you will get the Dashboard with following dashlets:
> Activity Summary > My Routes or All Routes
- Activities Summary: It displays summary of all the activities like Task, Phone calls Appointment, Service Activity of current day in list view. You can search the record as per inserting Dates. You can check the user wise Summary. Only a user who has Admin rights will get the Filter option.
- My Routes: It shows list of all routes for the particular day. For normal user, it shows routes assigned to them or created by them while admin user can view routes of all users.
You can check your Route or All Routes by selecting from the drop down of Select Route. You can update the Status like Completed/Cancelled along with that you can view the Route and reschedule it.


Custom Dashboard
You can configure the custom dashboard as per your requirement by selecting the entity and its relevant records.
For that navigate to the Dashboard Configuration from the MappyField left side navigation pane. [1]
From the Dashboard Configuration, you can create a new customize dashboard as per your requirement, for that click on the + New. [2]
- You need to insert the following details to customize the dashboard:
– Name: Insert the relevant name for the Custom dashboard
– Entity Name: Insert the Entity name.
– Query: Insert the Query to customize the records.
After inserting the details click on Save button.
Now, navigate to the MappyField Dashboards → MappyField 365 Custom Dashboard. [3]
By clicking on the MappyField 365 Custom Dashboards, you will get the Custom dashboard which you have configured. [4]


Compatible With Mobile Devices
- MappyField 365 plugin is compatible with mobile and tablet devices, so sales reps and marketing managers will have flexibility to access data from anywhere and everywhere.
