


In Mappyfield 365 you can plot the records of particular entities based on different Search Options. You can search and plot the records based on five Search filters, they are Region, Drawing, Territory, Proximity, and By User.
So let us see how the Region and Drawing filters work:
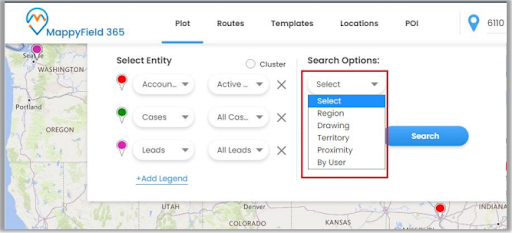
Region Filter
- The Region option lets you plot records on the map based on the region of your choice.
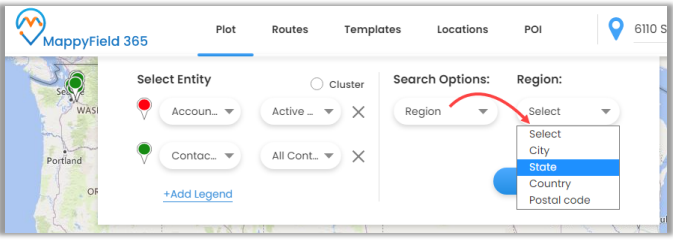
- You can select any City, State, Country, and Postal Code as the Region that you want to check records for.
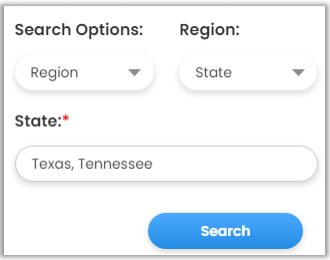
- If you select the State, you need to enter the name of the state that you need to check the records on the map of.
- Users can also plot multiple regions in the map by adding a comma (,) separated values. For example: Texas, Tennessee, etc.
- Now, if you click on the Search button, only the inserted states get highlighted on the map along with the records that come under that state.
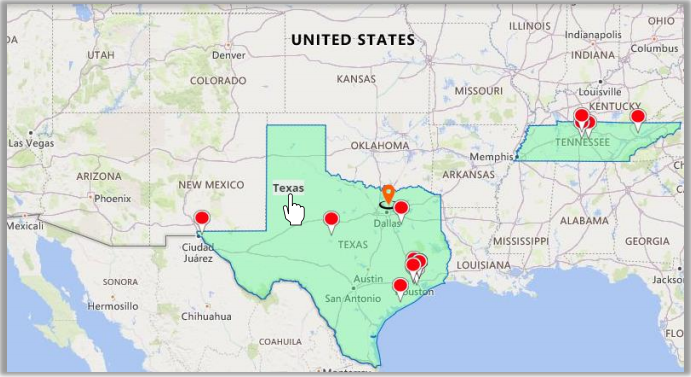
- By clicking on any region, it will display a Summary Card for the selected region.
- You can see details in the Summary Card of the selected State/Region.
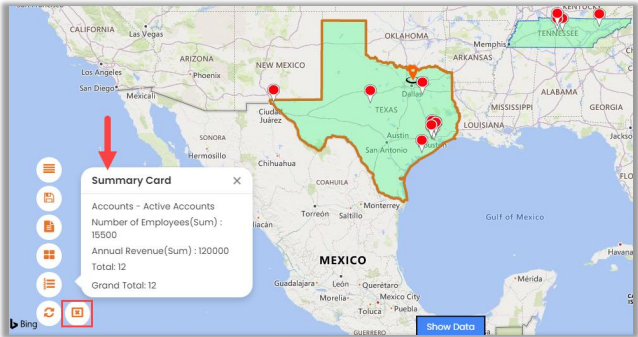
- If you want to deselect any region just click on the close X icon.
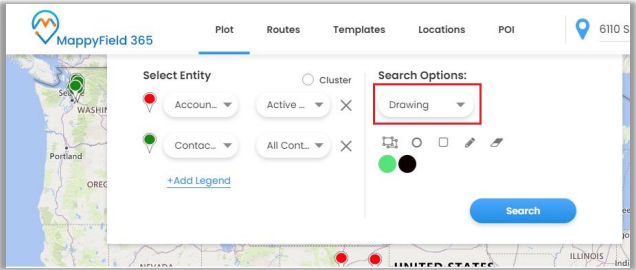
Drawing Filter
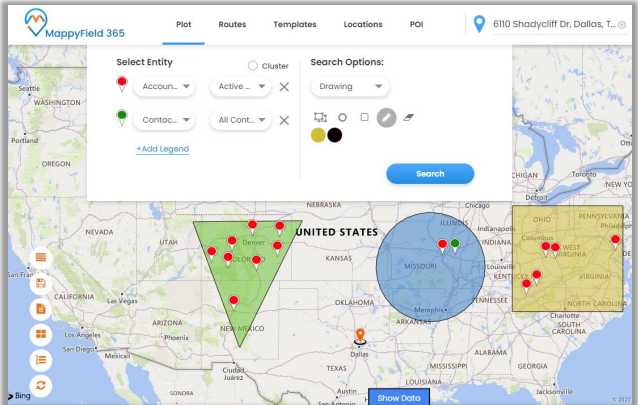
- You can plot the data by drawing and defining your own shapes. By selecting the Drawing search option, the drawing tool will enable you to draw a Polygon, Circle, and Square shapes.
- You will get to see the records as per your drawing on the map.
- You can edit the drawn shape by selecting the “Edit” icon. After clicking the Edit icon, you can move the shape and increase/decrease the area of the shape.
- You can remove the drawn shape by selecting the ‘’Erase” icon and then click on the shape.
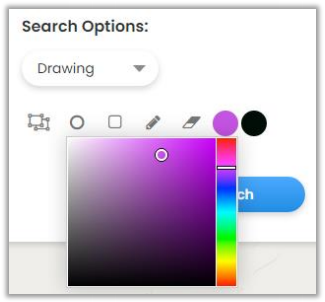
- You can change the filled color and the outline color of the shape.
- The color picker option is given to change the color of both.